
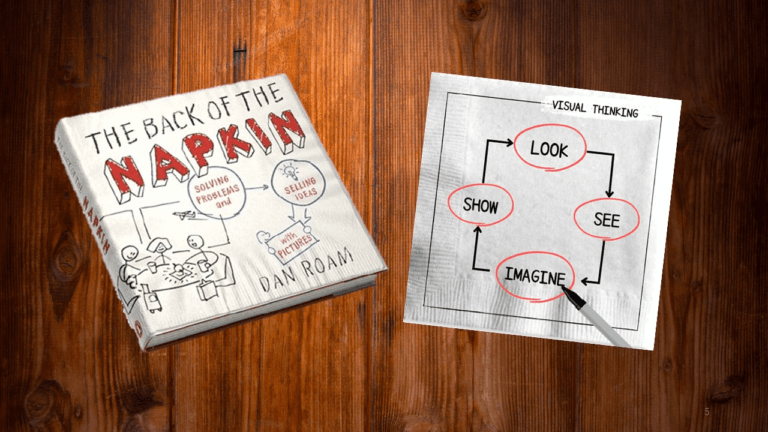
Book review: The Back of the Napkin
Visual Thinking is a must-have skill for a better career to thrive in this new data age
2022/5/25
Author: Aqmar Zakaria
Summary/Abstract
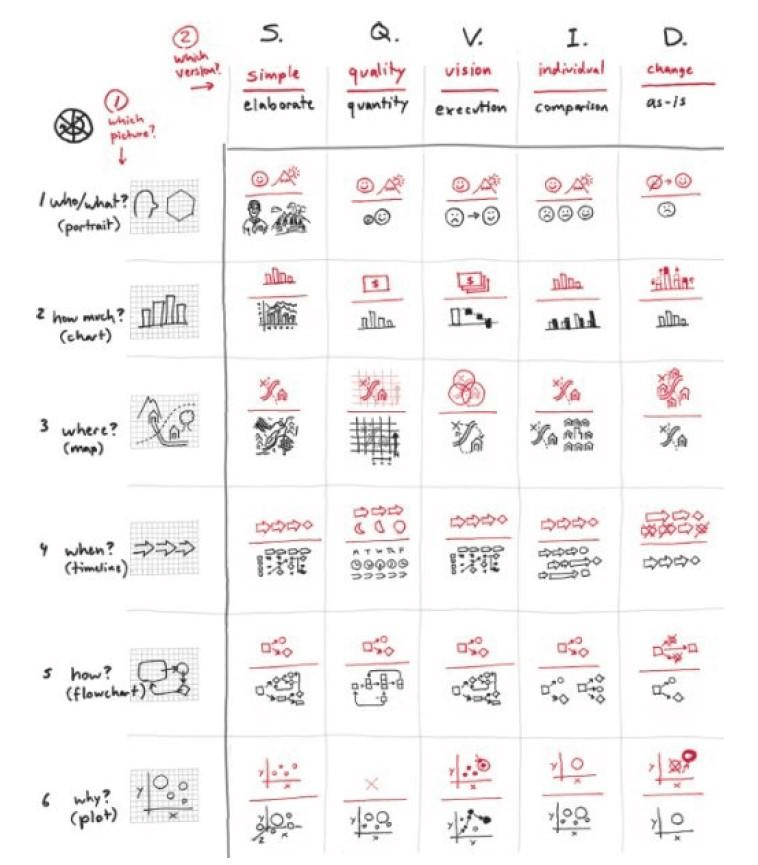
Visual thinking problem-solving skills are sought after more than ever before in this digital age. The book “The Back of the Napkin”, by Dan Roam is a highly recommended read for managers, entrepreneurs, consultants, startup founders or anyone in a position required to organize information or process complex information and turn it into understandable visuals – not just by simplifying or omitting essential information just because it is difficult to understand. The <6> <6> model is a guide for selecting the right framework for demonstrating information. The SQVID concept (acronym for Simple, Quality, Vision, Individual, Change) lets you think upfront and decide about the image before diving into drawing or creating visualizations. In the field of business process modeling, process mining is a good example of data visualization whereby AI is used to process complex data extracted from computer systems and transformed into understandable flow charts and dashboards. The book brought back memories of my days as a Ph.D. student, of my mentor who taught me ways to effectively deliver a piece of complex information to a general audience. “What is the main objective of this visualization? is a key question that you need to ask yourself. Is the visualization Conceptual? Declarative? Data-driven? or Exploratory?
In conclusion, The Back of the Napkin reaffirms the importance of breaking down complex notions into simple drawings when sharing an idea across different cultures or levels of expertise.
The story behind the title
The Back of the Napkin is a book published in 2008, so it has been around for 14 years. The book got its name from the author’s experience, Dan Roam, which to him was a superb discovery. Dan Roam is the author of five international bestselling books on business-visualization and communication clarity. The story began when his colleague requested him to cover for a speech to British educational experts and after saying yes to the request, he learned that he had to travel from New York to Sheffield, UK on the following day for the job. He barely had been briefed on the details of the speech. He only learned about the title in the morning before the speech from his British colleague during their first meeting on the train from London to Sheffield. When the colleague asked him to walk through the presentation material – in fact, he did not prepare beforehand since it was a very last-minute trip – he randomly drew the pertaining points on a napkin based on his knowledge and experiences in the internet industry.
During that time, using pictures as a business tool was still new compared to these days – whereas they are widely used nowadays. This book enlightens readers on the concept of solving problems with pictures in the early 2000s. When I say pictures, I am referring not only to images of objects, but also charts, graphs, etc. to visualize ideas and complex data so that it is comprehensible to the target audience.
Visual thinking problem-solving approach
At the heart of business success is the art of problem-solving and Roam’s book introduces visual thinking problem-solving methods mainly for managers, entrepreneurs, consultants, startup founders, etc. According to Roam, “visual thinking means taking advantage of our innate ability to see – both with our eyes and with our mind’s eye – in order to discover ideas that are otherwise invisible, develop those ideas quickly and intuitively, and then share those ideas with other people in a way that they simply get”. In brief, it is a means to organize thoughts, process complex information, and transform them into understandable visuals – not by making it simple.
During his trip to Sheffield, Roam learned the necessity of having a reliable problem-solving toolkit or universal visual thinking toolkit that we can pull out of our pocket at a moment’s notice. Therefore, he formulated a practical way to communicate visually by providing a framework or toolkit to determine which type of visual should be used to best represent the information. In the showing process, he formulated the <6><6> model (Exhibit 1) to guide the reader on what is the right framework for demonstrating the information and SQVID (Exhibit 2) to help the reader to think upfront and decide about the image before drawing or visualizing. The frameworks simplify the approach, thereby even beginners in visual thinking would be able to grasp the skill.
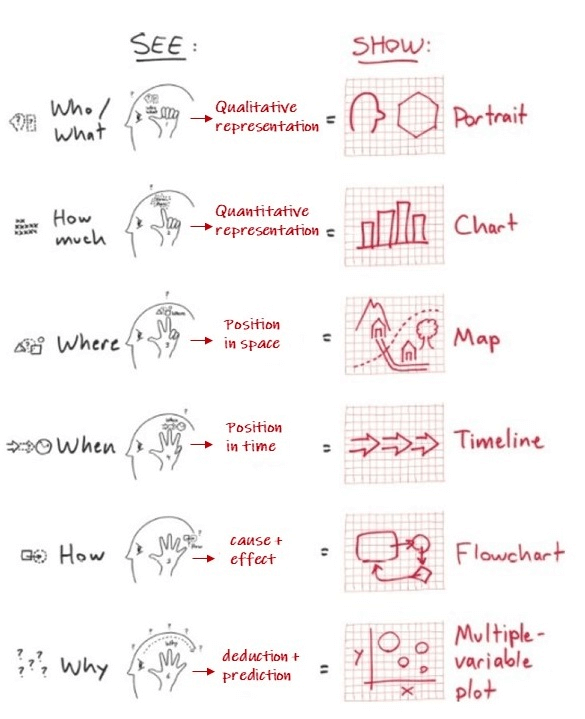
Exhibit 1: <6><6> model from the book
Data visualization
Data visualization is one of many visual thinking approaches. It has been traditionally used in branches of science as a medium to share findings. However, it has left the exclusive confines of scientific research and become a common practice among business professionals as well. Data visualization is the art of storytelling by capitalizing on collected data and translating the data into a visual context. Communicating complex information with pictures would provide means for our brain to understand and identify the underlying patterns and trends in large data sets. The application of data across businesses is the primary force in data visualization or “dataviz”. Data volumes continue to increase exponentially and are forecasted to reach 175 zettabytes by 2025 according to a report by IDC [1]. In today’s job market data visualization skill is likely a must-have skill for managers. Data science jobs are on-demand nowadays as more and more organizations rely massively on data analytics to thrive in their businesses.
Process mining and business process flowchart
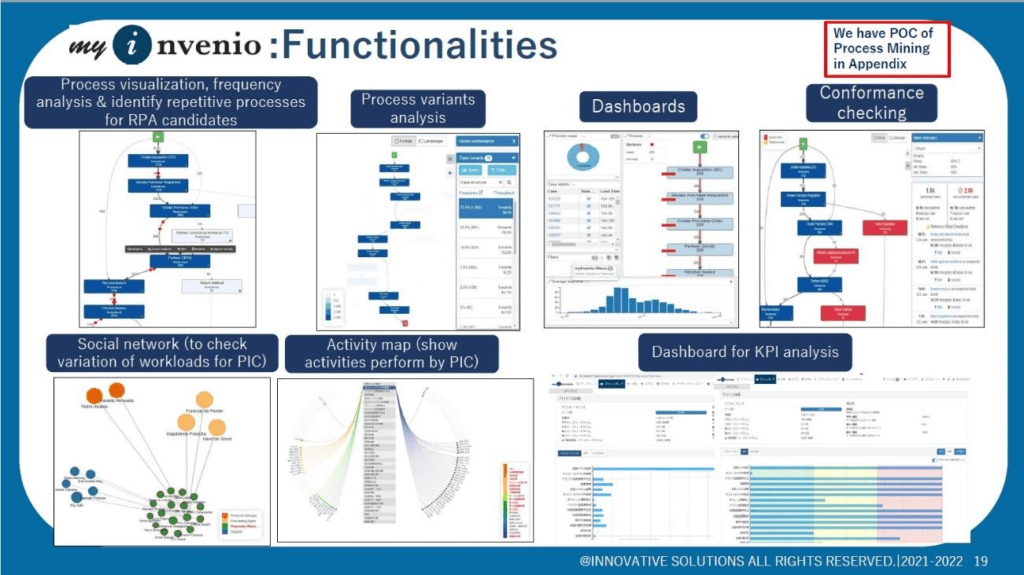
Process mining is a good example of a data visualization platform powered by artificial intelligence technology [2]. It is a tool or platform to visualize the underlying information from company IT system datasets for particular metrics, for instance, business process visualization, frequency analysis for each process to identify Robotic Process Automation (RPA) candidates, social network to check workloads for each employee, etc. I would recommend this platform for managers to optimize the processes across departments or physical sites and to strategize operational efficiency.
Interestingly, according to Roam’s book, in the 5th framework (refer to “How” in Exhibit 1), the flowchart is the visual to answer the question of how according to the <6><6> model and SQVID. A business process flowchart refers to a graphic representation of sequential business processes and also visualizes the relationship between tasks and related items i.e., person in charge, and output generated. Based on my experience working at ISOL, normally the flowcharts are created to standardize business processes, to inform stakeholders on how to achieve intended business goals by referring to and following the processes. On top of that, business process flowcharts help to define operating procedures that ultimately facilitate businesses to achieve better quality control and employee understanding. Besides, the purpose of visualization of business processes is to track down bottlenecks or unnecessary steps in order to improve the processes.
Personal experience becoming a visual communicator
I first learned the importance of visual thinking and how to convey an idea with pictures while I was preparing a deck to be presented at an international conference. Thanks to a professor that I would call a mentor to me during my Ph.D. study. She guided me to be a good presenter and communicator and I won an award for one of the best presentations (Ph.D. candidates’ category) during the conference. Scientific research is always a piece of complex information and it is not easy to deliver the idea into accessible information for the general audience. However, if you fail to make your complex research understandable, people will not understand and will not know how the finding would benefit them. My finding becomes fruitful only when others also understand my research and see the value it would bring to society. Thus, it is vital for any presenter to equip themselves with the ability to convey an idea in a form that is highly accessible.
Types of visual communication
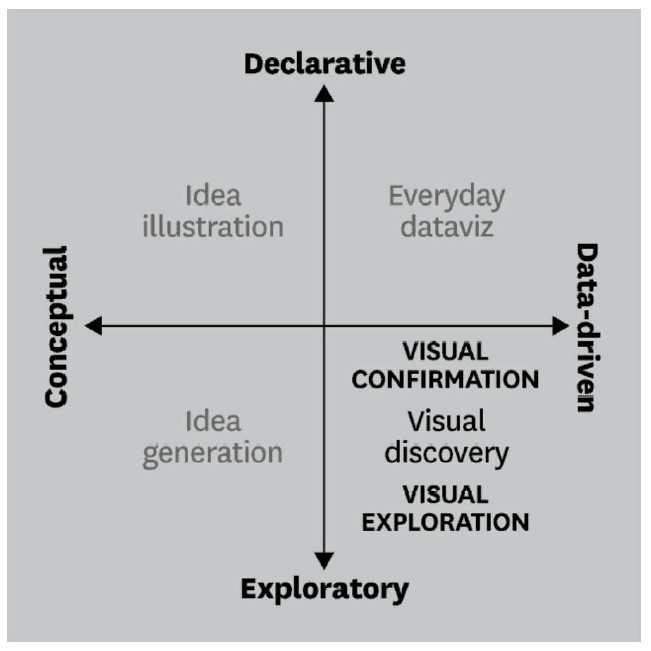
An article by Harvard Business Review (HBR) [3], illustrates the 4 types of visual communication based on 2×2 quadrants (as shown in Exhibit 4) that I learned about idea illustration, idea generation, visual discovery, and everyday dataviz. Each quadrant represents a different nature and purpose of visual communication. When talking about visual communication, it reminds me of how I always dealt with an abundance of data for my Ph.D. research. There was a machine named X-ray diffractometer (XRD) that I often used to analyze the surface topography and morphology of my samples [4]. The machine analyzed and produced a dataset on an excel file. Without doing data visualization, the dataset becomes futile. Therefore, I had to anticipate the hypothesis before plotting a chart and what kind of elaboration the chart would give. I had to be clear about the purpose of visualization to enlighten the audience about my finding – to show the insight that couldn’t be seen before. This is an example of visual discovery and visual confirmation types.
Takeaways
Based on my journey of developing visual thinking and problem-solving skills, there are four simple but important tips;
- Before anything, set the presentation’s background and goal
- Know your audience
- As Roam’s book suggests, choose the right showing framework (<6><6> and SQVID)
- Make the visual accessible and straightforward
By mastering the basic visual problem-solving skills mentioned in Roam’s book, the reader will develop the ability to communicate visually. However, to become an exceptional visual communicator, a broader notion and strategic approach which has been described in the abovementioned HBR article, is required.